

|
|
 |
Correlation of relative Z error with local curvature |
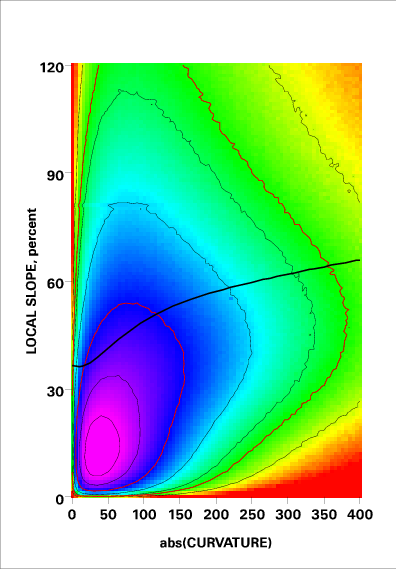 |
Correlation of local slope and local curvature Curvature values are
those
reported by
ArcInfo CURVATURE command. From the ArcInfo documentation: CURVATURE is the second derivative of the surface (i.e., the slope of the slope), calculated as Curvature = -2(D + E) * 100 Coefficients D and E are estimated by fitting the function Z = Ax2y2 + Bx2y + Cxy2 + Dx2 + Ey2 + Fxy + Gx + Hy + I to the values in a 3x3 window |