Recent Climate Changes in Western Washington
Our studies have shown that temperatures on Blue Glacier can be closely estimated using measurements from radiosonde balloons launched at Quillayute about 65 km WNW of the glacier. The National Weather Service have launched balloons in western Washington twice daily since 1948. Measurements indicate annual temperatures at 850 mbar (~ 1450 m) have increased by 1.2oC since 1948. This rate of warming is about five times higher than the global average. Most of the warming has occurred during winter; the average winter temperature (January through March) has warmed 3.3oC.
Mean monthly surface temperature and temperature at 850 mbar, only on days when Forks had precipitation, vs. mean monthly precipitation (mm/day) at Forks, over 1948-96 (Rasmussen and others, 2000).
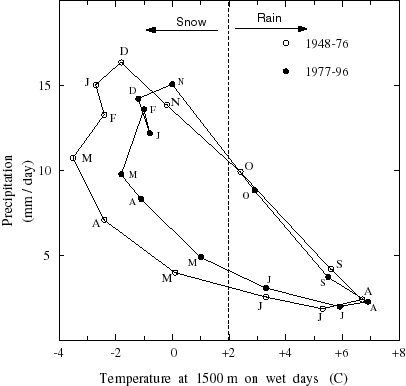
Mean monthly temperature at 850 mbar on wet days, versus mean monthly precipitation at Forks for periods: (i) 1948-1976, and (ii) 1977-1996. The plot shows that the recent warming and drying has been mainly a winter phenomenon.
We scale measurements from Forks to estimate the total precipitation on the glacier. Results indicate precipitation has decreased and, in addition, winter warming has changed the rain/snow mix of precipitation. Snow accumulation (1914-1996 snowfall) on the glacier has changed considerably. Annual snowfall near the terminus has decreased by more than 500 mm since 1948.
Precipitation data from Forks, WA
Estimated winter (October-May) accumulation at 2100 m and the difference
between it and accumulation at 1500 m, both in mm water equivalent.
Precipitation was derived by scaling daily measurements at Forks, a
nearby low-elevation station. Estimates for 1915-1947 come from a
rain-fraction model (Rasmussen and others, 2000 ). Estimates for
1948 to present come from a radiosonde model in which precipitation at
altitude z is assumed to be snow when Tz<2oC.
Tz comes from interpolating within the temperature profile
measured by the radiosonde at Quillayute. Horizontal lines are
best-fitting piecewise-constant function (Rasmussen and others, 2000 ).