CONSISTENCY analysis of World Bank - ImageCat - RIT/Kucera Haiti
earthquake lidar data
Ralph Haugerud
US Geological Survey
Seattle, WA
6 August 2010
rhaugerud@usgs.gov
Introduction
Several recent conversations have touched on the quality of lidar
data from southern Haiti collected for the World Bank shortly after the
12 January 2010 earthquake. In an effort to better understand these
data, and to inform discussion about possible future lidar surveys in
Haiti, I have looked more closely at the World Bank data using my CONSISTENCY
analysis tool.
About the data
I have seen only limited documentation for these data. They were
collected between 21-27 January 2010 with an airborne Leica ALS60
sensor. The aircraft was based in Santo Domingo, DR. Data collection
and post-collection calibration appear to have been without any ground
control in Haiti and without idifferential GPS base stations in or near
the target area. Metadata
documents hosted at OpenTopography reference TerraPOS PPP software,
thus I infer that Precise Point Positioning was used to improve GPS
solutions. The metadata documents indicate flying heights of 2500 -
6500 feet above ground level. I have not yet found any documentation of
beam divergence, scan angle, or pulse repetition rate.
These data were collected and processed rapidly, with the primary
purpose of rectifying imagery collected on the same flights and making
DEMs and imagery available for post-earthquake relief efforts. The
metadata documents stress that flight plans were optimized for image
collection, not lidar collection, and that the processing (particularly
boresight calibration and ground point identification) were "ortho
grade".
From my analysis it appears that at least some of the data were
collected with a single-swath pulse density of about 2.5 pulse/m2
and 25% sidelap (that is, 1/2 of the area has double coverage). There
was partial cloud cover on some swaths, and at least one swath is
intermittent and has unexplained large Z offsets. Cloud points and (or)
points with large Z offsets were assigned LAS point class 15. All
returns are numbered 1 or 2; it is not clear whether there were no 3rd
or 4th returns from this terrain, the instrument only recorded the
first two returns, or these are the first and last returns.
These data are in the public domain. They may be downloaded from the
IPLER website at
the Rochester Institute of Technology.
Limitations of my analysis
This analysis has at least two important limitations. First, I only
examined a spatially-limited subset of the data. My results and
conclusions may not be relevant to other parts of the survey. Second,
CONSISTENCY analysis provides only a lower limit to the absolute
accuracy of a lidar data set. For other projects in which good
independent ground control is available, it is evident that absolute
errors may be as much as twice as large as the swath-to-swath errors
identified by CONSISTENCY analysis.
Conclusions
These data are good!
P1, the estimated aggregate Z error, is ~4 cm. This is a respectably
low value typical of lidar surveys acquired under the best conditions
with extensive ground control. If this is typical of PPP GPS, the cost
of further lidar work in Hispaniola is likely to be less than I would
have guessed, as it appears that adequate data can be obtained without
close-by differential GPS base stations.
P2 value, the estimated aggregate XY error, is ~50 cm. This is not
so good. I'm accustomed to seeing values of 20-30 cm in similar
terrain. My guess is that the large XY error reflects the speedy
post-processing, and that with more time Kucera would have derived a
better pointing (boresight) calibration, though perhaps better pointing
calibration would require independent ground control.
With smaller XY errors, or processing data on a swath-by-swath basis
(so that swath mismatch is not a problem), I think a skilled TerraSCAN
operator could produce a better bare-earth DEM from these data.
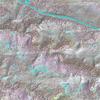
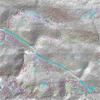
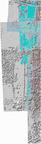
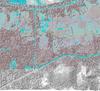
Graphic index to analyzed tiles
Note on tile names: The LAS
data are in files that correspond to 1 km x 1 km tiles, named according
to the UTM coordinates of the lower-left corner. That is, file
76670435.las has data for the 1 km2 area with a lower left
corner at 766,700m E, 2,045,500m N. To avoid impermissibly-long file
names during GIS processing, I renamed tiles so that, for example, tile
76670435 has become x766y43.
|
|
|
|
|
|
|
|
|
|
x762y51 |
|
|
|
|
|
|
|
|
|
|
|
|
|
|
|
|

x762y50 |
|
|
|
|
|
|
|
|
|
|
|
|
|
|
|
|
x762y49 |
|
|
|
|
|
|
|
|
|
|
|
|
|
|
|
|
|

x766y45 |

x767y45 |
x768y45 |
x769y45 |
x770y45 |
x771y45 |
|
|
|
|
|
|
|
|
|
|
x762y44 |

x766y44 |

x767y44 |
x768y44 |
x769y44 |
x770y44 |
x771y44 |
|
|
|
|
|
|
|
|
|
|
x762y43 |

x766y43 |

x767y43 |

x768y43 |
|
|
|

x722y40 |

x723y40 |

x724y40 |

x725y40 |

x726y40 |

x727y40 |

x728y40 |

x729y40 |

x730y40 |
|
|
|
|
|
|
|
|

x722y39 |

x723y39 |

x724y39 |
x725y39 |
x726y39 |
x727y39 |
|

x729y39 |
x730y39 |
|
|
|
|
|
|
|
|

x722y38 |

x723y38 |
x724y38 |
x725y38 |
x726y38 |
|
x728y38 |
x729y38 |
x730y38 |
|
|
|
|
|
|
|
|
x722y37 |
x723y37 |
x724y37 |

x725y37 |
x726y37 |
x727y37 |
x728y37 |
x729y37 |
x730y37 |
|
|
|
|
|
|
|
|
|
|
|
|
|
|
|
|
|

x761y20 |
|
|
|
|
|
|
|
|
|
|
|
|
|
|
|
|
x761y19 |
|
|
|
|
|
|
|
|
|
|
|
|
|
|
|
|

x761y18 |
|
|
|
|
|
|
|
|
|
|
|
|
|
|
|
|

x761y17 |
|
|
|
|
|
|
|
|
|
|
|
|
|
|
|
|

x761y16 |
|
|
|
|
|
|
|
|
|
|
|
|
|
|
|
|
x761y15 |
|
|
|
|
|
|
|
|
|
|
|
|
|
|
|
|

x761y14 |
|
|
|
|
|
|
|
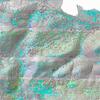
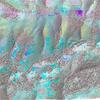
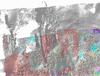
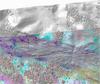
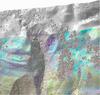
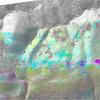
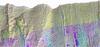
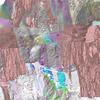
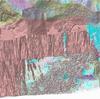
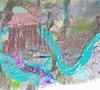
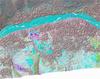
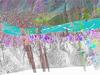
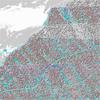
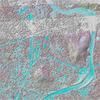
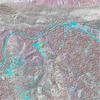
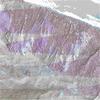
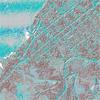
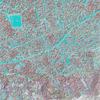
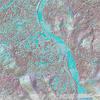
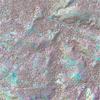
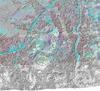
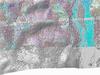
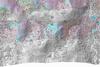
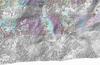
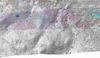
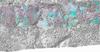
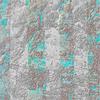
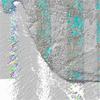
ground-return index
1st-return density index
ground-return density index
ratio ground-1st index
Estimates of global accuracy and completeness
Note that Z values are in survey units--meters or
feet--unless otherwise specified
P1 = 3.9 cm (rms Z reproducibility, flat
ground) P2 = 47.5 cm (rms
XY reproducibility) n ~ 460032
1st-return rms Z reproducibility
area average = 0.11
tile average = 0.17
1st-return 95th percentile Z reproducibility
area average = 0.14
tile average = 0.15
Ground-return rms Z reproducibility
area average = 0.24
tile average = 0.23
Ground-return 95th percentile Z reproducibility
area average = 0.41
tile average = 0.39
30 of 61 tiles with double-coverage low-curvature area greater than
0.01 km2
Fraction double coverage (area average) = 0.698
3.91 pulse/m2 (area
average) 3.5 pulse/m2
(tile average)
Averages exclude tiles x722y38, x723y39, x723y38, x724y39, x730y40, x761y15, x761y14,
as these tiles contain extensive marine water where tides and waves
make a time-varying surface and accurate data will be inconsistent from
swath to swath.
Tile summary
listed by decreasing 1st return rms Z
Tiles with duplicate returns
x762y43
x762y44
x762y49
x766y43
x766y44
x767y43
x767y44
x768y43
x768y44
x769y44
x770y44
x771y44
x771y45