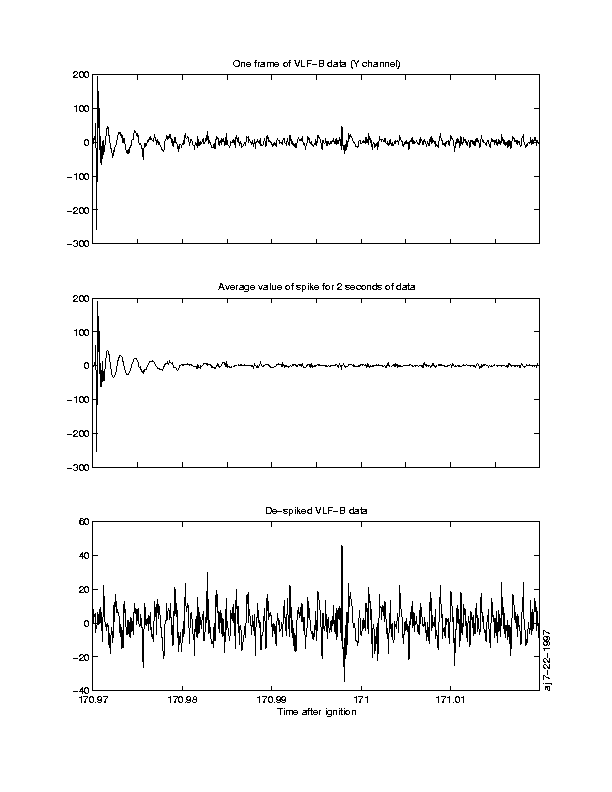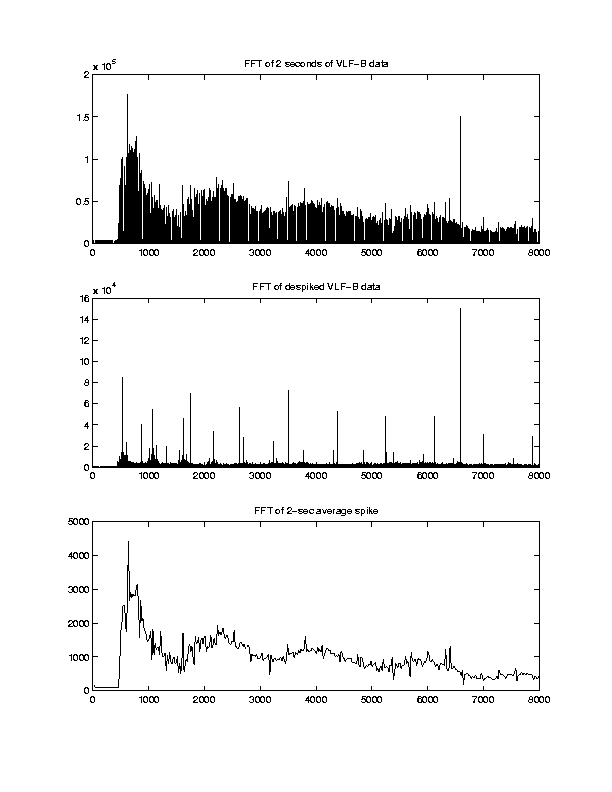
When we first looked at the VLF-B data in spectrogram form, it was obviously contaminated with noise, ~20 spikes per second. These vertical spikes occurred once per frame of data, probably originating from the high voltage sweep of the ESA instrument. In order to remove the spike waveform we looked at a frames worth of data (plot 1). Then we compared that to the average value of the spike, which we got by adding all of the frames on top of each other in 2 sec of data and then dividing by the number of frames (plot 2). When we looked at these superimposed, it was obvious that the spike was coherent and we could subtract it from the data. We sampled spikes from intervals throughout the flight and found them to vary slightly so we decided to subtract the spike from the data each time locally. Plot 3 shows the "de-spiked" data for a 2 sec interval. You can also see the spike waveform in the fft of the original data as the large grey envelope (plot 4). The fft after the spike has been removed looks much cleaner (plot 5). The remaining spikes represent horizontal bands of noise on the spectrogram. Harmonics are very evident as well as a particulary strong band at 6.6 kHz. In the last picture, we took the fft of just the spike, and observed that it corresponds well with the envelope of the spike in plot 4.

Plots 4-6