Alicia Hotovec-Ellis
Current Research
Inter-Eruption Evolution of Mount St. Helens Tracked by Coda Wave Interferometry
Mount St. Helens (MSH) erupted in 2004 after 18 years of quiescence, but the spatio-temporal movement underground of the magma that erupted at the surface remains a mystery. Swarms of deep (3-8 km) seismicity consistent with magmatic recharge beneath MSH occurred in 1989-1991 and 1995-1998, coincident with steam explosions and anomalous CO2 emission, respectively. Ground deformation observed between 1982 and 1991 was similarly consistent with magma recharge. However, there was no measurable ground deformation between 1991 and 2004. This evidence suggests that magma recharge likely took place during the 1989-1991 swarm, or alternatively, that it had already been mostly loaded to further erupt at the end of the 1980-1986 eruption.
On other volcanoes, small changes in seismic wavespeed have been observed prior to eruptions and coincident with possible intrusions of fluids. Seismic velocity changes may have also occurred at MSH, and we speculate that the nature of these changes could provide additional constraints on how the system evolved leading up to the 2004 eruption. We compared the waveforms of thousands of pairs of repeating high frequency (>5 Hz) earthquakes in the PNSN catalog that occurred beneath the volcano's summit between the last explosion in 1986 and the onset of eruption in 2004. We measure temporal changes in repeater coda arrivals and interpret them in terms of possible changes in seismic structure and/or source processes using coda wave interferometry. Preliminary results show many pairs of coda waves have linearly increasing or decreasing lag with time within the waveforms, indicative of systematic wavespeed changes. If attributed to shear velocity variations alone, they would need to be as large as 2% spread over several years and change most around the times of increased deep seismicity.
On other volcanoes, small changes in seismic wavespeed have been observed prior to eruptions and coincident with possible intrusions of fluids. Seismic velocity changes may have also occurred at MSH, and we speculate that the nature of these changes could provide additional constraints on how the system evolved leading up to the 2004 eruption. We compared the waveforms of thousands of pairs of repeating high frequency (>5 Hz) earthquakes in the PNSN catalog that occurred beneath the volcano's summit between the last explosion in 1986 and the onset of eruption in 2004. We measure temporal changes in repeater coda arrivals and interpret them in terms of possible changes in seismic structure and/or source processes using coda wave interferometry. Preliminary results show many pairs of coda waves have linearly increasing or decreasing lag with time within the waveforms, indicative of systematic wavespeed changes. If attributed to shear velocity variations alone, they would need to be as large as 2% spread over several years and change most around the times of increased deep seismicity.
Older Research
Repeating Earthquakes and Harmonic Tremor on Redoubt Volcano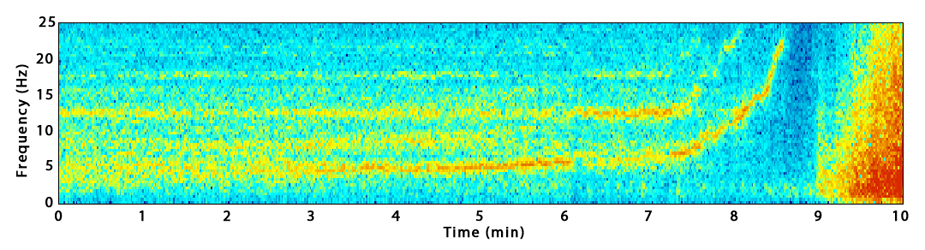 Spectrogram of one of the many "screaming" events. The high frequencies, upward curve of frequency, and pause prior to explosion were highly repeatable from event to event.
Harmonic tremor is a variety of continuous seismic signal commonly observed on erupting volcanoes that resembles sounds made by many musical instruments, although at lower than audible frequencies of between 1 and 5 Hz. During the March 2009 eruption of Redoubt Volcano in Alaska, upward gliding harmonic tremor was observed immediately prior to six nearly consecutive explosive events. These signals were endearingly dubbed "the screams" by seismologists at the Alaska Volcano Observatory because of their unusually high frequency content, up to a previously unheard of 30 Hz. Another surprise is that the spectral evolution of the signals is nearly identical from explosion to explosion, indicating a stable and repeatable process is at work in the moments before an eruption, but what?
In the ten hours before the first explosion with harmonic tremor, there was a swarm of over 1600 repeating "drumbeat" earthquakes. Over time, the earthquakes became increasingly frequent, eventually blending smoothly into tremor. We believe that the harmonic tremor can be explained as many more of these small, repeating earthquakes that are close together in both time and space. Further evidence seems to suggest that these earthquakes are caused by repeated stick-slip at or near the conduit wall as viscous magma works its way upward. A familiar analog to this case of harmonic tremor might be screeching tires or a squeaky door.
More...
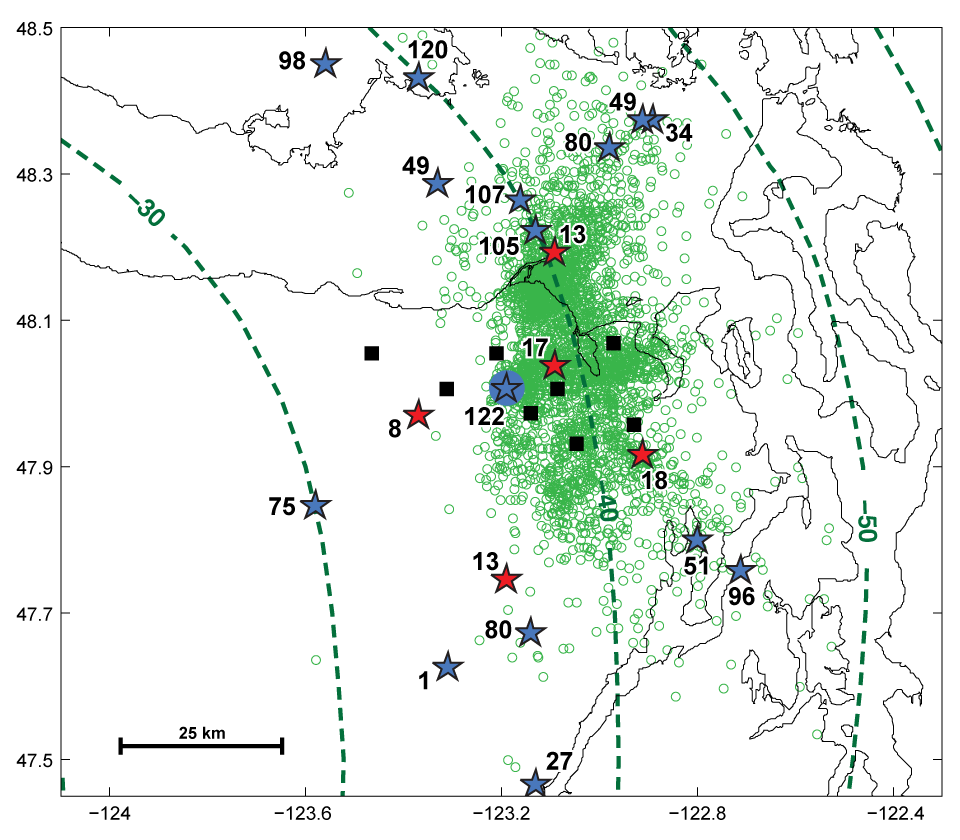 Locations of tremor (green circles) and earthquakes (stars) from Mar - Jul 2010. Depths are near slab
interface (contours).
Locations of tremor (green circles) and earthquakes (stars) from Mar - Jul 2010. Depths are near slab
interface (contours).
Episodic tremor and slip (ETS) has been observed in many subduction zones, but its mechanical underpinnings as well as its potential for triggering damaging earthquakes have proven difficult to assess. Here we use a seismic array in Cascadia of unprecedented density to monitor seismicity around a moderate 16-day ETS episode. In the four months of data we examine, we observe five tiny earthquakes within the subducting slab during the episode (red stars), and only one more in the same area (circled blue star), which was just before and nearby the next ETS burst. These earthquakes concentrate along the sides and updip edge of the ETS region, consistent with greater stress concentration there than near the middle and downdip edge of the tremor area. Most of the seismicity is below the megathrust, with a similar depth extent as the background intraslab seismicity. The pattern of earthquakes that we find suggests slow slip has a more continuous temporal and spatial pattern than the tremor loci, which notoriously appear in bursts, jumps, and streaks.
For this project, I was in charge of locating the small, weak earthquakes using a combination of Array of Arrays and network data. Although only a small handful of earthquakes made it into the paper, I located at least a hundred more by hand.
More...
For this project, I was in charge of locating the small, weak earthquakes using a combination of Array of Arrays and network data. Although only a small handful of earthquakes made it into the paper, I located at least a hundred more by hand.
More...
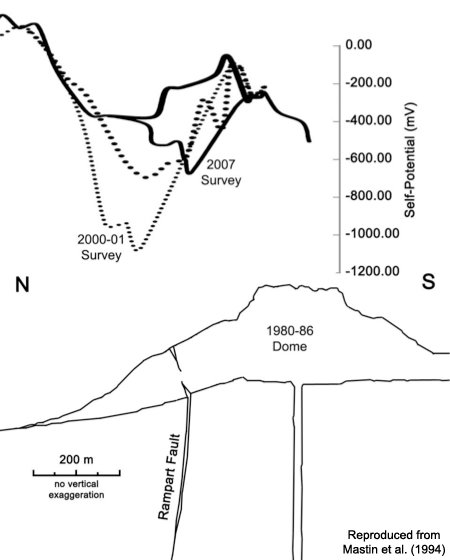 Cross-sectional view of Rampart Fault with corresponding SP anomaly. The hydrothermal system remained surprisingly intact through a dome-building eruption in 2004.
Knowledge of groundwater flow due to hydrothermal circulation in volcanoes is important in evaluating the risk of volcanic activity and potential flank collapses. Indeed, hydrothermal alteration can weaken slopes and increase risk of collapse during eruptions. Unfortunately, hydrothermal systems are complex and difficult to image in volcanic areas. Self-potential (SP) is a passive electrical method that is sensitive to groundwater flow and can therefore be used to understand the pattern of the hydrothermal systems. The SP method requires only light equipment that is easy to use in the difficult field conditions of active volcanoes. Self-potential measurements were taken on Mount St. Helens volcano in 2000, 2001, and 2007. Mount St. Helens is of particular interest because the north flank of the volcano was removed in a large-scale sector collapse in 1980, allowing a deeper look into the structure of the volcano. These measurements were accompanied by time-domain electromagnetic (TDEM) measurements, which provide information about the resistivity structure. The SP signal combined with local geology and resistivity structure allows a rudimentary hydrogeologic model of Mount St. Helens to be built. This model was then tested using COMSOL Multiphysics©, a commercial finite-element modeling program, to reproduce the SP data. Modeling indicates that the large negative anomaly (800 mV) near the dome can be explained by downward flow through the Rampart Fault, a large fracture that was visible at the surface following the 1980 eruption.
I helped collect the SP and TDEM data over a two-week period in July 2007. Best field experience to date! It's hard to beat helicopters, epic views, and camping on a volcano.
More...
I helped collect the SP and TDEM data over a two-week period in July 2007. Best field experience to date! It's hard to beat helicopters, epic views, and camping on a volcano.
More...