The Runup Table summarizes the elevations and
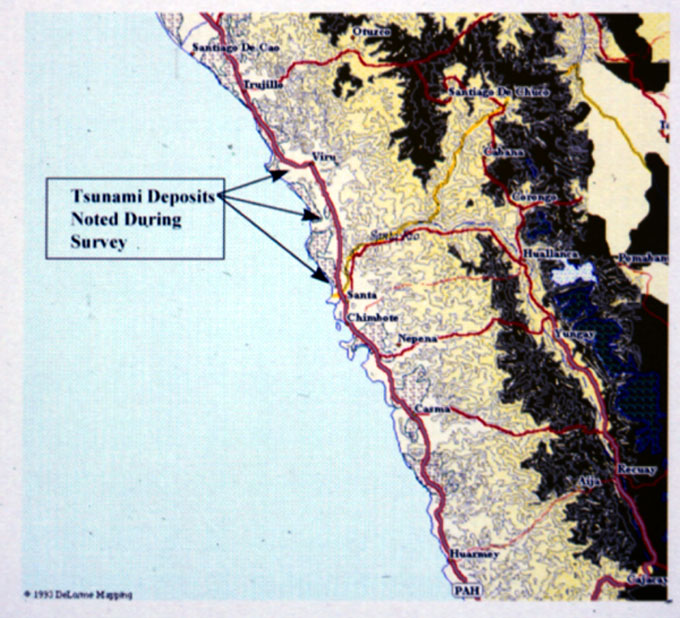
inundation distances computed to date. The data are listed from south to
north along the coast using the local name for the area. In this table
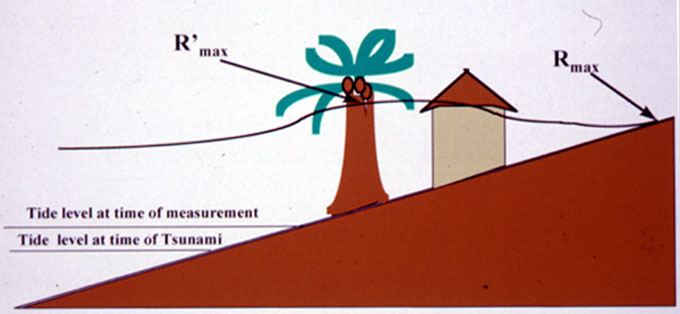
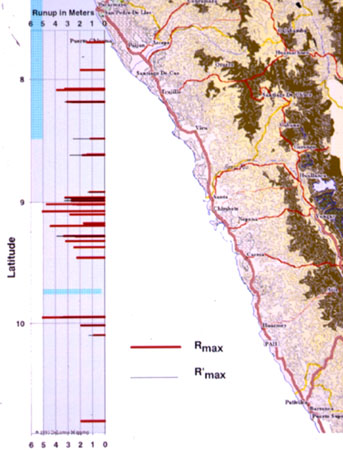
Rmax signifies the runup height at the maximum inundation distance
whereas R'max signifies the maximum observed water surface at any
location. Lmax refers to the inundation distance onshore (See photo above).

Observations have been classed as A, B, or C according to the dependability
of the data. The term "na" indicates survey data that are not yet
available.
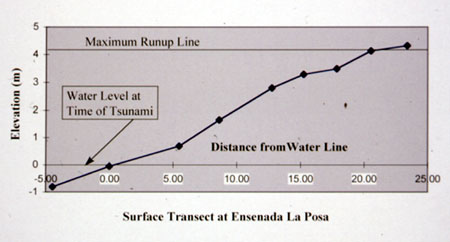
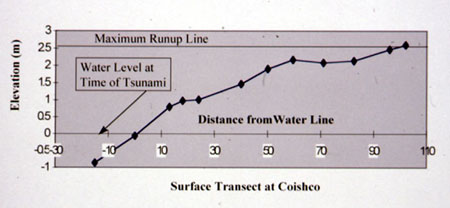
The runup data have been corrected for the tide difference at the time of
measurement and the computed tide at the time of the tsunami. Place
names have been abbreviated for insertion into the table. Runup heights
generally varied between 2 and 3 m except in areas where there was some
topograhy to focus the tsunami.
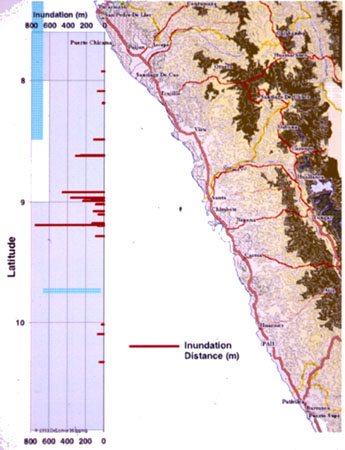
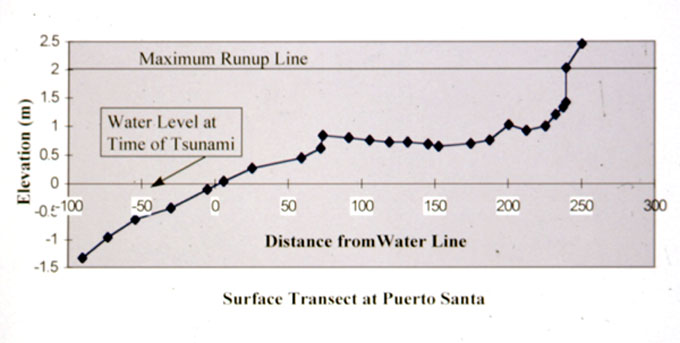

Although the runup heights were not extremely high, inundation distances were sometimes quite large because of the flat beach slopes. Several of the inundation distances were well over 200 m. In one instance the tsunami inundated an entire isthmus, near El Dorado, approaching from both sides to cover a distance of 1500 m and carrying fishing boats 300 m onshore.